
Direct Memory Access is a feature that enables transferring data between peripherals and/or memory at the highest possible speed. This is done using direct hardware access to read or to write to the main memory without any supervision or interaction from the main CPU. DMA connections and accessories have become widely adopted due to their numerous uses and to the very important speedup they allow.
However, attackers managed to take advantage of this feature by creating a rogue peripheral that connects to the DMA controler and use it to gains access to any part of the computer’s physical memory. This allows the attacker to bypass operating system security policy, and eventually gain access to sensitive information such as cryptographic keys, or instead install malware.
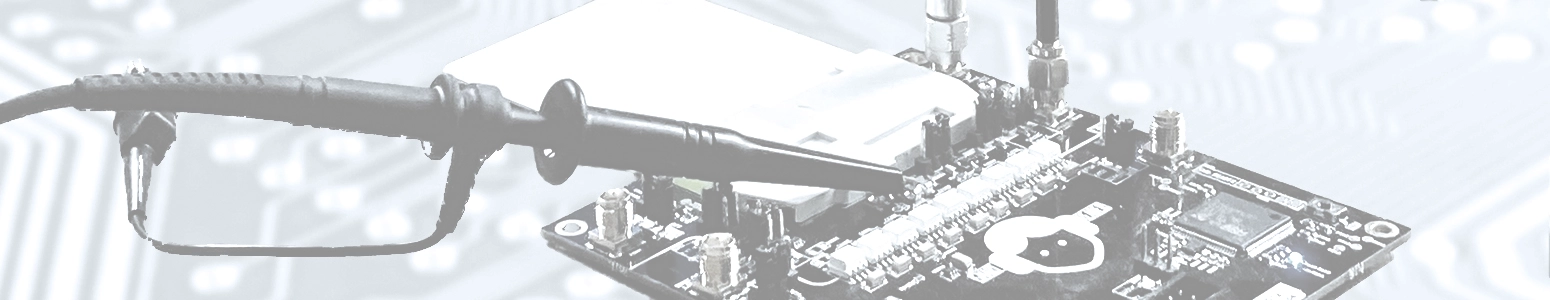
PCILeech is a tool that uses PCIe hardware devices to read and write target system memory via DMA over PCIe. The tool can insert a range implants into targeted kernels, providing easy access to live ram and to the file system via a “mounted drive.” PCILeech runs on both Windows and Linux and currently supports x64 versions of UEFI, Linux, FreeBSD, and Windows. A hardware device like (PCIeScreamer)[https://shop.lambdaconcept.com/home/50-screamer-pcie-squirrel.html] is required to write access to memory.
Debugging the PCILeech code executed on targeted systems under DMA attacks can be challenging, mainly due to the payload being executed on a separate device attached to the PCIe bus. As a result, the host system lacks direct access to its memory or control over its execution, making it difficult to use essentially debugging techniques such as setting breakpoints or examining memory content. Furthermore, the payload may be encrypted or obfuscated, making the debugging process even more complicated. As a result, various reverse engineering techniques and tools have been developed, including QEMU-based emulation, firmware extraction and analysis, and dynamic analysis using virtual machines or other debugging tools.
In this blog post, we introduce a convenient way to learn and debug DMA attacks on virtualized or re-hosted systems using QEMU. This approach enables connecting GDB to the Linux kernel.
Getting a symbolized kernel
Finding kernel symbols is essential for debugging provides valuable information about the internal state of the kernel and the execution of the system. Without symbols, it is difficult to identify the source of errors, trace the execution path, or set breakpoints at specific locations in the code.
Many embedded systems run Linux kernel, on them it may not be neither easy nor possible to recompile the Linux kernel to enable debug symbols. This is due to the limited resources of these devices have in memory or in storage space. In such situations, vmlinux-to-elf may be the solution see our previous artilcle.
QEMU
QEMU is a useful tool for setting up an emulated testing or unstable system, especially when working on the Debian installer or boot system. It is also useful for trying out experimental features without affecting the productive system.
The QEMU emulator is packaged as qemu
sudo apt install qemu qemu-utils qemu-system-x86 qemu-system-gui
Standard target system (x86)
Pre-baked images created by DQIB can be downloaded from (here)[https://people.debian.org/~gio/dqib/].
Each downloadable file is a ZIP archive that contains the root filesystem, kernel, initrd, and a readme text file. The readme file includes launch commands and authentication information.
Setting up a testing/unstable system
A debian target system can be set up with the following steps:
- Create the hard disk using the qcow2 disk image format.
QCOW2 (QEMU Copy On Write version 2) is a file format for disk image files used by QEMU. It is a successor to the original QCOW format and provides several advantages over its predecessor. QCOW2 is a sparse file format, meaning that it only stores the actual data written to the disk image, rather than allocating space for the entire image at creation. This makes QCOW2 images smaller in size and faster to create and transfer over networks. Additionally, QCOW2 supports compression and encryption, allowing for further reduction in image size and added security. QCOW2 also supports snapshots, which allow users to save the state of a virtual machine at a specific point in time and revert to that state later if needed. Overall, the QCOW2 format provides a more efficient and flexible solution for disk image storage in virtualized environments.
qemu-img create -f qcow2 debian.qcow 4G
** WARNING ** If you’re installing a desktop environment, you’ll need more than 2G.
- Download a current boot image, such as the businesscard image, you can visit the following link: http://cdimage.debian.org/cdimage/daily-builds/daily/arch-latest/amd64/iso-cd/
wget https://cdimage.debian.org/cdimage/daily-builds/daily/arch-latest/amd64/iso-cd/debian-testing-amd64-netinst.iso
- Boot the image with:
qemu-system-x86\_64 -hda debian.img -cdrom debian-testing-amd64-netinst.iso -boot d -m 512
** Notes **
- If you have KVM, you can use it by including the option -enable-kvm.
- When the usual debian boot screen appears, boot into “expert” mode.
- Install the system as usual; to set up a sid system choose “unstable” when being asked by the installer.
- Boot the test system image:
qemu-system-x86\_64 -hda debian.img -m 512
Setup Shared Memory for QEMU
When it comes to debug a pcileech module, it may be of interest to expose the RAM of a hardware platform emulated in QEMU. The QEMU monitor allows to inspect the memory but is not necessarily the most practical tool when you need to access it from another process, e.g., a C program like pcileech.
The QEMU Documentation suggests to use memory-backend-memfd to share the memory with external processes. But for this plugin we preferred to use the memory-backend-file with the /dev/shm virtual filesystem. This allows us to give the file a name. This makes sharing the memory with pcileech easier because it can be done by file name instead of file descriptor.
According to the QEMU documentation, it is suggested to use the memory-backend-memfd for sharing memory with external processes. However, for this plugin, we chose to use the memory-backend-file with the /dev/shm virtual file system instead. This allows us to assign a name to the file, making it easier to share the memory with pcileech by using the file name rather than the file descriptor.
To enable the memory backend on our virtual machine, we need to add the memory-backend-object to our command line.
- add the memory-backend-object to the command line
memory-backend-file,id=mem,size=512M,mem-path=/dev/shm/qemu-ram,share=on -machine memory-backend=mem to your QEMU configuration
- Enable remote debugging
We also enable remote debuging with the folling parameters:
gdb tcp:localhost:9000 -enable-kvm
- Launch the virtual machine
 qemu-system-x86_64 -kernel vmlinuz.x86_64 -m 512  -drive format=raw,file=debian.img,if=virtio,aio=native,cache.direct=on, \
                    -gdb tcp:localhost:9000 -enable-kvm -append "root=/dev/mapper/cl-root console=ttyS0 earlyprintk=serial,ttyS0,115200 nokaslr" \
                    -initrd initramfs.x86_64.img \
                    -object memory-backend-file,id=mem,size=512M,mem-path=/dev/shm/qemu-ram,share=on
Leechcore configuration
Leechcore is a tool used for hardware hacking, specifically for analyzing and manipulating the memory of a running computer system. It operates as a kernel module that is injected into a running Linux kernel, allowing it to access and manipulate the memory of the system.
The core functionality of Leechcore is to provide a way to read and write to the memory of the target system. This is achieved by intercepting the input/output operations of the PCI bus, which is responsible for connecting hardware devices to the system. Once the module is loaded and the appropriate configurations are set, it can intercept the communication between the CPU and the hardware devices, allowing it to read and write data to the memory.
Leechcore also provides features for analyzing and manipulating the running kernel, such as obtaining information about running processes and their memory allocations, detecting the presence of rootkits, and bypassing security measures like kernel address space layout randomization (KASLR).
Overall, Leechcore’s functionality makes it a powerful tool for hardware hacking and analyzing the security of computer systems.1.
- Write target memory at address:
pcileech -device 'qemu://path=qemu-ram&size=512' write -min 0x12345678 -in 0x9090ebfe
- Display memory at address :
pcileech -device 'qemu://path=qemu-ram&size=512' display -min 0x12345678 -max 16 -out leech.bin
Debugging kernel and DMA using GDB
From there, you can use the GDB breakpoint tracepoint and watchpoint commands to debug your code as needed. QEMU with the -s -S options to enable GDB server mode and stop the execution at the start. Then, connect to the GDB server using the target remote command in a separate terminal.
GDB Breakpoints
For debugging purposes, if you want to set a breakpoint at the function address 0x12345678 (for example, at start_kernel), the gdb command to use after starting Qemu would be:
gdb ~/linux/vmlinux
 (gdb) set arch i386:x86-64:intel
 (gdb) add-auto-load-safe-path ~/linux
 (gdb) target remote:9000
 (gdb) b 0x12345678
 (gdb) c
GDB tracepoints
GDB tracepoints allows developers to collect data at specific points in the program’s execution without halting the program. This allows for more targeted and efficient debugging, as well as reducing the overhead associated with traditional breakpoints.
To define a GDB tracepoints use the tbreak command followed by the function name or memory address where you want to set the tracepoint. This will allow you to trace the execution of a specific function or memory location. Once the tracepoint is hit, GDB will stop and print out information about the execution. You can then use the continue command to resume execution. Tracepoints can be useful for debugging complex code that involves multiple function calls and/or loops.
GDB watchpoints
GDB watchpoint allows you to break the program execution when a specified variable is accessed or modified. It is a powerful debugging tool that helps you detect when a certain variable or memory location is modified or read, and take action accordingly.
To use GDB watchpoints, you can use the watch command followed by an expression that evaluates to a memory location or variable. GDB will then monitor that memory location or variable and break when it is read from or written to. This can be useful for debugging issues related to memory access, such as buffer overflows or use-after-free errors. Watchpoints can be set to break on read, write, or both. You can also set conditions on the watchpoint, such as breaking only when a certain value is read or written.
To set up a watchpoint on a memory range in GDB, you can use the watch command followed by the memory range. For example, to watch the memory range from address 0x1000 to 0x2000, you can use the following command:
watch *0x1000@0x1000. This sets a watchpoint on the memory location 0x1000 with a size of 0x1000 bytes.
This sets a watchpoint on the memory location 0x1000 with a size of 0x800 bytes. Any access to memory within this range will trigger the watchpoint.
Conclusion
In conclusion, QEMU and the associated tools provide powerful capabilities for developers and researchers working with virtualization and emulation. By leveraging QEMU’s flexible architecture and rich set of features, it is possible to create and manage virtual machines, debug software, analyze system performance, and more. While there is a learning curve associated with working with QEMU and related tools, the benefits in terms of productivity and flexibility can be substantial. By using the tips and techniques outlined in this article, developers and researchers can get up to speed quickly with QEMU and start leveraging its capabilities to accelerate their work.
References
- DMA Fundamentals on Various PC Platforms, from A. F. Harvey and Data Acquisition Division Staff NATIONAL INSTRUMENTS
- mmap() and DMA from Linux Device Drivers, 2nd Edition, Alessandro Rubini & Jonathan Corbet
- Memory Mapping and DMA, from Linux Device Drivers, 3rd Edition, Jonathan Corbet, Alessandro Rubini Greg Kroah-Hartman
- DMA and Interrupt Handling
- DMA Modes & Bus Mastering